installation
the model.
Scenarios
and References
CASMOFOR
version 7.0
description
POOLS
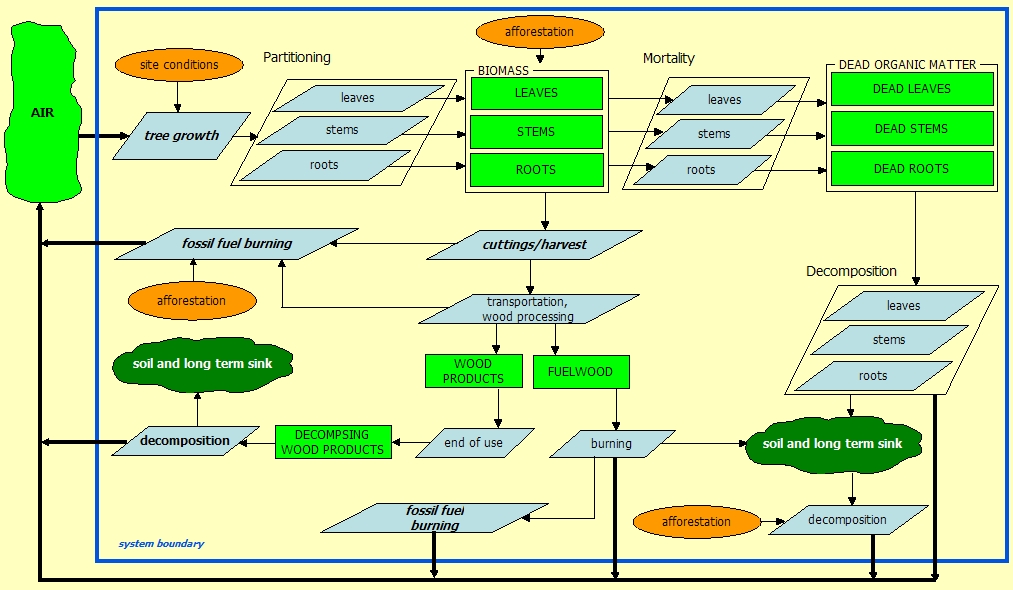
Pools are „containers” that contain carbon at any point in time. Their content is increased by the incoming fluxes, and decreased by the outgoing fluxes. Except for soil and other long-term sinks, which are denoted by dark green clouds, pools are denoted by green boxes on the flowchart. Pools that are used or modelled in CASMOFOR are as follows:
Description – Modelling – Accuracy, sources of error – Accounting functions
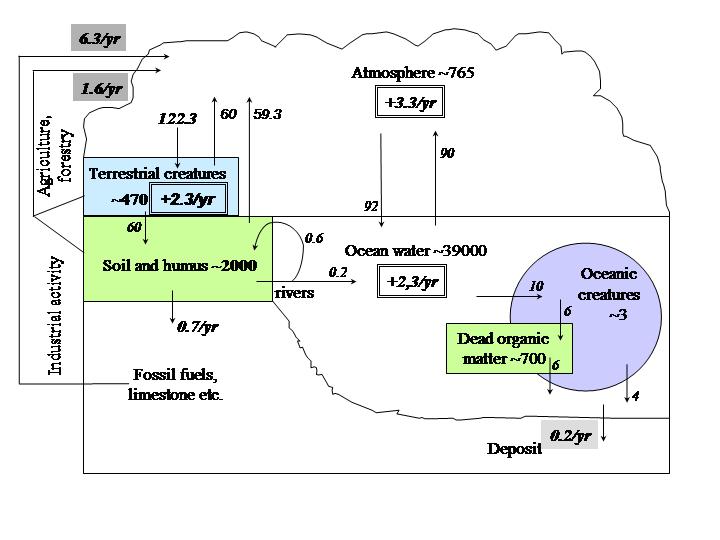
Air is one of the pools of Earth that contain huge amounts of carbon in various forms, mainly carbon-dioxide. The main carbon pools of the Earth are charted here (data are estimates in year 2000, source: Houghton et al., 1994, Dixon et al., 1994, Cannell, 1995, and IPCC 2000).
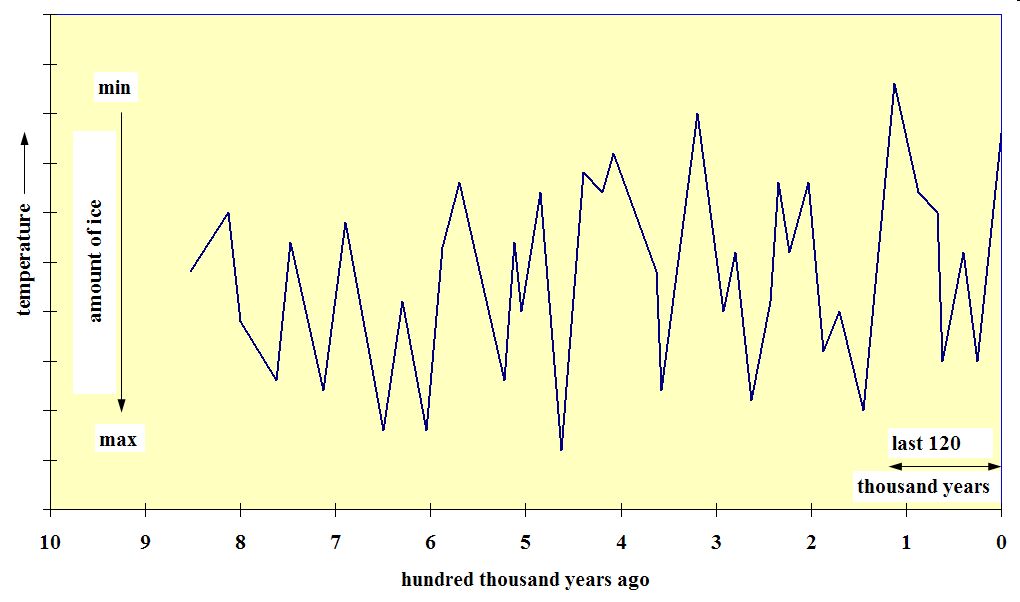
The high CO2 content of the air is suggested to be one of the main causes of climate change (IPCC 2001). Climate change shows itself in many ways, and the increase of temperature (see graph) is only one of them.
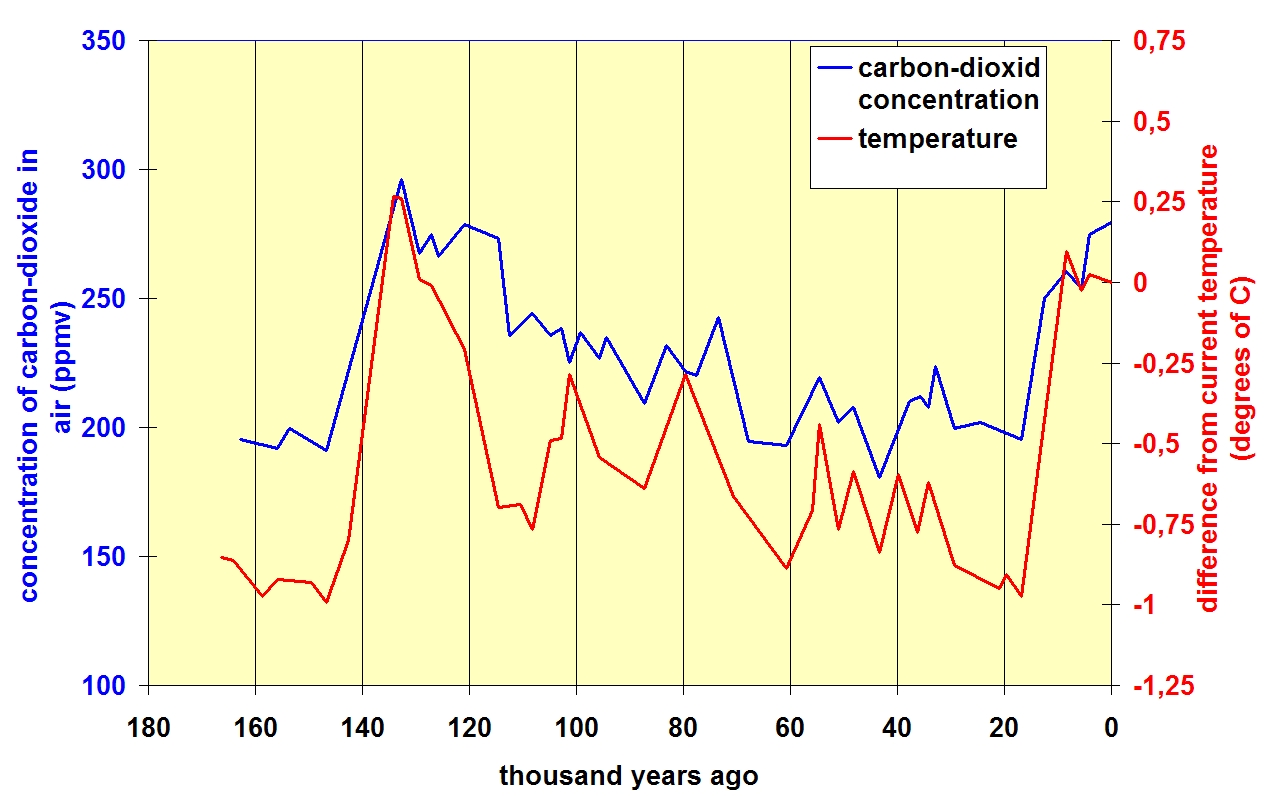
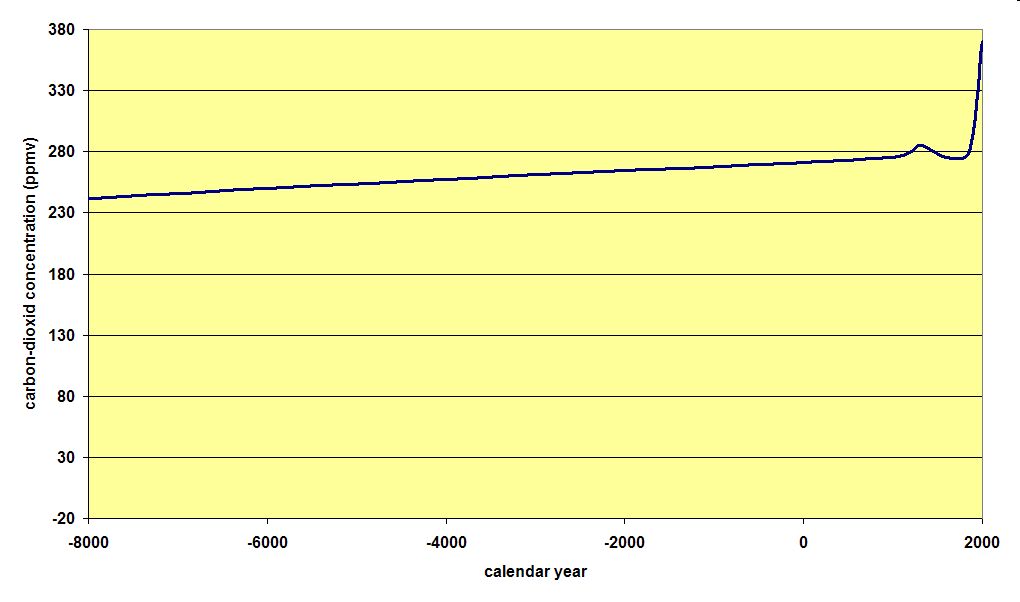
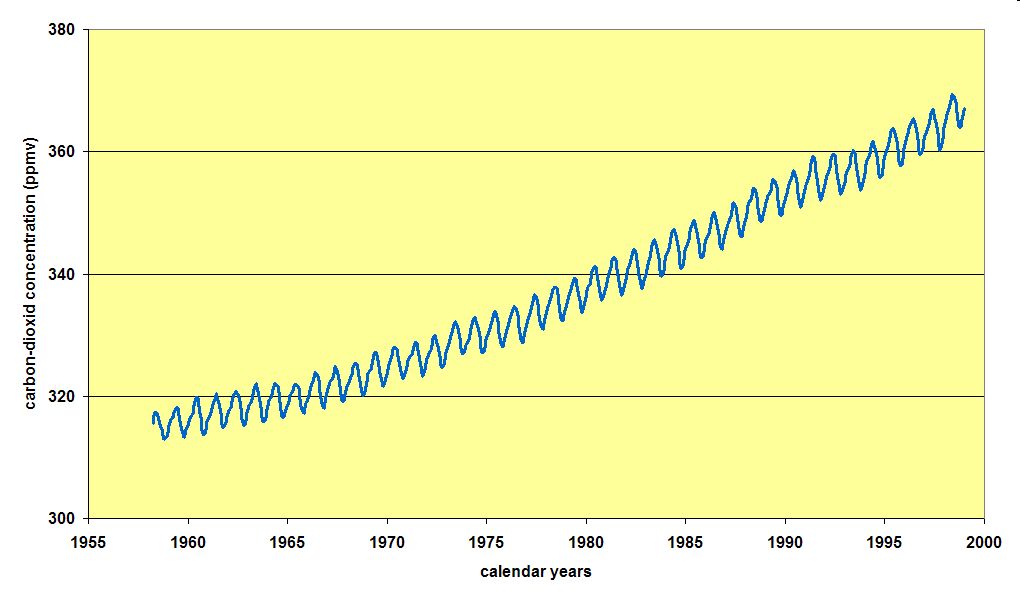
The increase of the temperature of the air has been reconstructed for the past million, hundred thousand and thousand years, and the CO2 content has been reconstructed for the last hundred thousand and ten thousand years measured in the last five decades (sources: Barnola et al., 1987, Bolin et al. 2000, Cannell, 1995).
That the temperature of the air correlates well with its CO2 content (which is demonstrated by this graph, redrawn from Barnola et al., 1987) is explained by the fact that CO2 is one of the so called greenhouse gases: it traps the energy of the light coming to the Earth from the Sun, thus heating up the atmosphere. It is estimated that CO2 alone is responsible for some 50-60% of the greenhouse effect (source: Pálvölgyi-Faragó, 1995). This effect is beneficial to a certain level, because the temperature of the Earth would be much lower in the lack of greenhouse gases, but may turn adverse if too much energy is trapped due to too much of the greenhouse gases.
The change of the CO2 concentration in the past happened due to the forces of nature. However, mankind started to emit large amounts of carbon to the air by various means. First, deforestation was the primary source of emission, later, emission by burning fossile fuels became much more intensive (see graph).
The emission of greenhouse gases is largely uneven among countries. Developed countries like the USA, Canada, Japan, Australia and many European countries are responsible for much of the emission (see total emissions for all developed countries, as well as detailed data for 1990 and 1999; this is also demonstrated by a computer-aided graph showing the varying night lights on the continents).
The IPCC (Intergovernmental Panel on Climate Change) estimates that decrasing the emission by some 60% would be needed to stabilize the current CO2 concentration of the air. However, even fulfilling the commitments of the much debated Kyoto Protocol (of the UNFCCC) could result in a mere 5,2% decrease of emissions compared to the 1990 level.
Because of the above, all possible means must be used in order that these committments are fulfilled, and that climate change can be mitigated.
Among these means, forestry has several ones. In Hungary, there are also forestry means that could be used to remove carbon from the air. These can be grouped by means to protect existing carbon pools, and those to increase carbon pools (see Table 1 below).
Table 1. Possible means of forestry to mitigate climate change and their relative importance. (Theoretically, the potentials of forestry in the whole world are to fix 60-87 billion t C until 2050. The greatest potentials are at the tropics with optimal management of 300-600 million ha of forest (amounting to fixing 36-72 billion tC, which is 80% of all potentials). In the temperate zone, the potential is to fix 13-26 billion t C (17%), and in the boreal zone, 2,4-5,6 billion tC (3%). Considering large countries: the potential of Russia is 4,5-11 billion tC, that of the USA is 15 bilion tC, whereas China has 172, and India 175 million ha of land where afforestations for carbon can be made; Canell, 1995.) See more, and more updated data, in the most recent reports of IPCC, the Special Report on Land Use, Land Use Change and Forestry, and the Mitigarion section of the Fourth Assessment Report.
| Preserving current C-stocks |
Relative importance |
|
| globally | in Hungary | |
| Preserving current forests | ●●●●● | ● |
| Preventing stands from degradation (e.g. overthinning, improper selection in thinnings) | ●●● | ● |
| Preserving soil carbon | ●●● | ●● |
| A fatermékek széntartalmának megőrzése | ● | ● |
| Increasing carbon stocks |
Relative importance |
|
| globally | in Hungary | |
| Increasing forest area | ●●● | ●●●●● |
|
Increasing the C-density of the current forests |
● | ●● |
|
Increasing the amount of carbon in wood products |
● | ● |
|
Substituting fossile fuels by wood |
Relative importance |
|
| globally | in Hungary | |
| Increasing the area of forests to produce firewood | ● | ●● |
| Increasing, decentralizing and modernizing wood energy use and its infrastructure | ? | ●● |
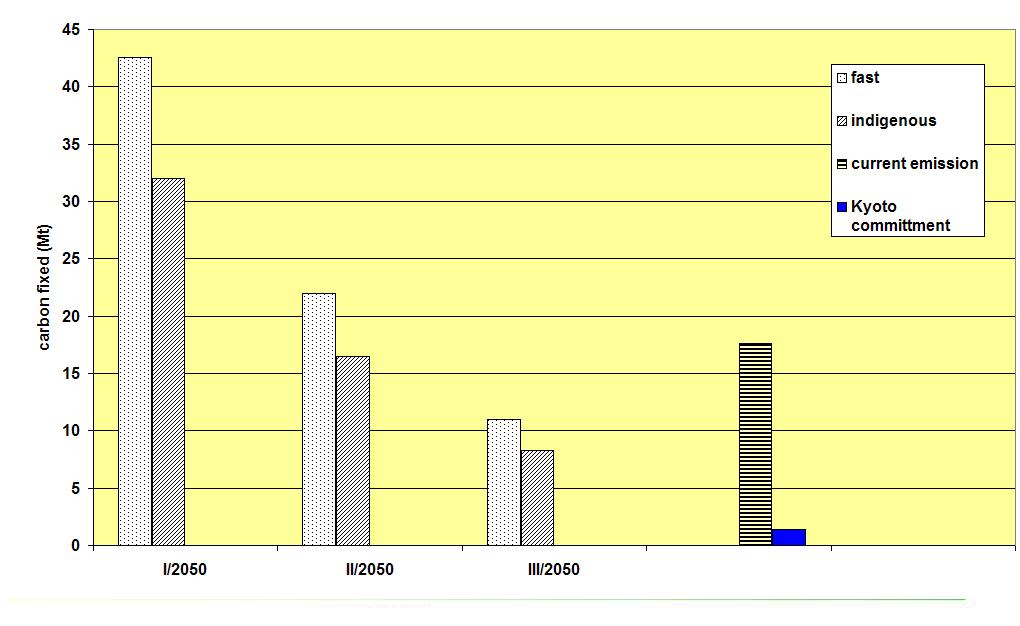
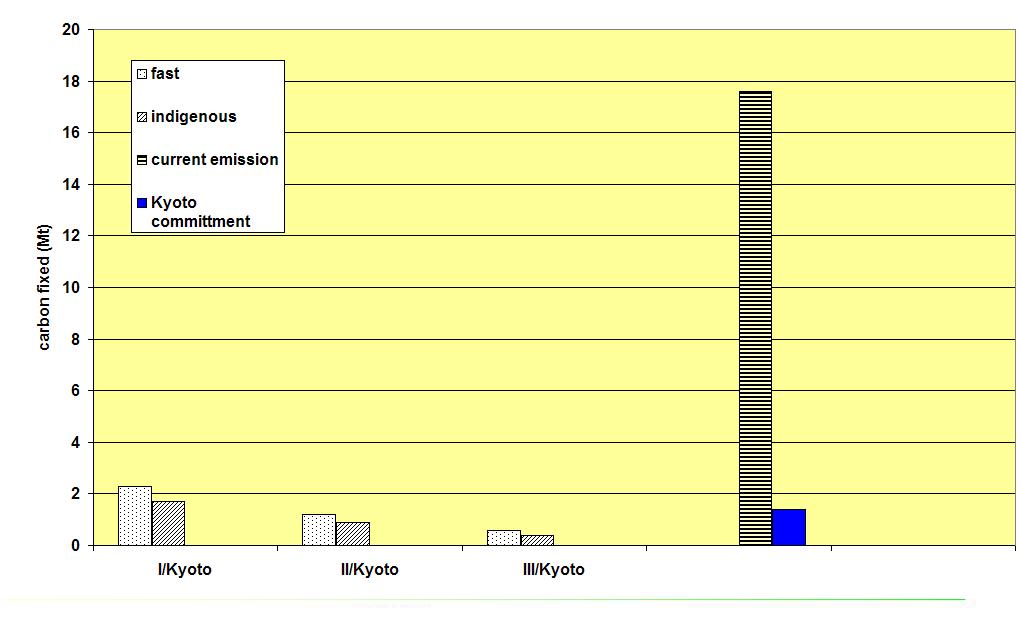
As it can be seen also from the above table, afforesting (or reforesting) large areas is the only possible means in forestry by which relatively large amounts of carbon could be removed. In a recent study, which was based on running CASFOR, the predecessor of CASMOFOR, possibilities were estimated in three (I, II, III) scenarios of intensive afforestations (afforesting 773, 400 and 200 thousand hectare of abandoned agricultural fields in 50 years with either predominantly fast growing exotic tree species, or mainly with slow growing indigenous tree species). Total removable carbon in these scenarios are shown over time here. This is not much compared to the annual emission of the country, but is comparable to the committment of Hungary in the Kyoto Protocol.
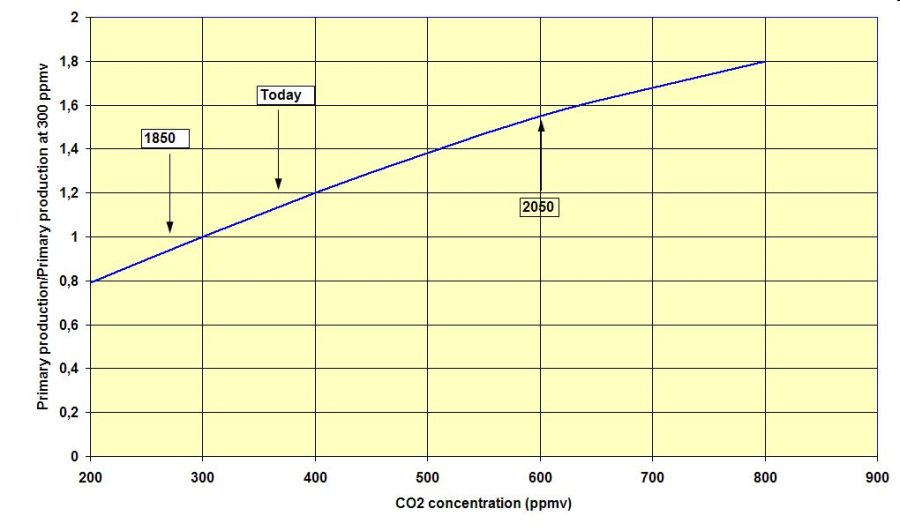
The CO2 concentration of the air is not modelled. It is taken as a fixed pool to which all carbon gets from the forestry system, and from which plants can fix as much carbon as they want. However, since it increases over time, the concentration can have a bearing on the physiological processes of plants (see growth) and also on the ecosystem processes, like the distribution of pests and pathogens, distribution of tree species, stress tolerance and others that may susbstantially change carbon cycle over time.
Limitation, accuracy, sources of error
N/A. See also growth.
Description – Modelling – Accuracy, sources of error – Accounting functions
Biomass is the total of living beings in a predefined area expressed in substance terms. It can be expressed, e.g. in tons of dry weight, or tons of weight etc. Together with other indicators, such as number of species or diversity at the same area, it can be used to characterize how intensive life in that area is.
Biomass can be broken to aboveground and belowground biomass, or to biomass of plants, animals and other creators etc. Breaking down in modelling carbon cycle is usually necessary because processes associated with the various biomass types, or pools, can be very different.
The change in biomass (B) for the entire forest area at any year (t), deltaB, is the resultant of increases due to growth (G), and decreases due to mortality (M), thinnings (T) and final cuttings (FC):
|
deltaB = (Bt - Bt-1) = Gt - Mt - Tt - FCt |
(If there is final cutting in a stand, thinning is zero, and vica versa, but mortality can still happen in both cases. For the entire forest of several stands, both thinnings and fincal cuttings must be accounted for.)
Similar equations apply to the components of biomass. Thus, deltaBw is the change in the woody biomass pool from year t-1 to t etc.
In the first step to estimate biomass growth (G), the volume growth of woody parts of the aboveground biomass is approximated. This is because we only have "good", practical estimates for this fraction of the aboveground parts of trees (gross current annual woody biomass increment (CAI) is taken from the yield tables, see section on growth). From volume growth, constants (basic wood density values, Dw) are used to estimate the increase of woody biomass increment of trees (see also partitioning):
deltaBw = CAI * Dw
Note that, in Hungary, volume of trees means the volume of all aboveground parts of the tree, including branches and leaves, therefore, no special BEFs are needed for total aboveground volume and biomass. To see the basic wood density values used, see Somogyi, 2008.
In the second step, similar constants (biomass expansion factors, BEFs) are used for the other biomass pools, i.e. leaves (as also parts of the aboveground biomass) and roots (both coarse roots and fine ones, as parts of the belowground biomass pool). These factors are used for partitioning total net photosyntetic products.
Thus, the increase of leaf biomass from the woody biomass increment is estimated the following way:
deltaBL = deltaBw * BEFL, and
the increment of root biomass from the stem biomass increment is estimated by the following formula:
deltaBR = deltaBw * BEFR
(Note that the biomass of non-woody plants and animals are not modelled in CASMOFOR).
With each factors to estimate change in a pool, average values for medium quality sites (site class III and IV, see section on growth) are used. For poor sites (site classes V and VI), 10% higher, whereas for good sites (site classes I and II), 10% lower factors are used.
Note that identical D and BEF values are used for mortality (M), thinnings (T) and fincal cut (FC).
All processes that decrease biomass (and increase other pools), i.e. mortality, thinning and final cutting, are also estimated by CASMOFOR. These processes are described in details in the respective sections of this help.
The value (deltaWwt + Mwt + Twt + FCwt) can be referred to as the net woody biomass increment.
Biomass values are estimated from estimation of various processes. The calculation of biomass from these processes is a simple accounting of all processes. Therefore, the accuracy of biomass values totally depends on how accurate the various processes are. See details at every process.
Description – Modelling – Accuracy, sources of error – Accounting functions
With respect to carbon cycle, soil is an essential part of forest. It contains high amounts of organic matter that were accumulated over many years of soil development. Even in climax forests, soil organic matter can increase by a slow but steady accumulation of undecomposed organic matter.
Depending on the soil type, the carbon content can be several times of the biomass of mature forests. This underlines the importance of preserving carbon in soils, and not only in those under existing forests, but also in soils of lands to be afforested. More and more avidence has been accumulating on how much carbon can be lost if grassland is converted, and also after soil preparations, which expose the soil layers with organic matter to oxigene, where the organic compounds break down quickly. It may even happen that the carbon loss due to such soil preparations can offset the amount of carbon fixed in biomass even for decades. Moreover, there are proofs that afforestations even without soil preparation can result in carbon loss from soil for years.
The organic matter content of the soils is modelled by adding new carbon for a limited period of time, after which soil is regarded to be filled in with organic matter until its capacity under forest vegetation, and by removing carbon due to various disturbances (including the conversion itself). Details can be found here.
The increase of the soil carbon content is only approximately modelled, and only for good measure. We do not have approppriate data or models in Hungary to model long-term carbon accumulation rates in the forests. However, the accumulation rate is taken to be small, so even if it is not properly models this process, the carbon accumulation of the whole forestry system, which must be of primary concern when running the model, is practically unaffected.
Description – Modelling – Limitation, sources of error – Accounting functions
After their death, the body of living beings and their parts starts to decompose, or is eaten by other creatures. This transformation takes time, which can be short, e.g. for fruits, but can take decades in case of roots, bark and even wood. Decomposition results in increase of body mass of decomposing creatures, but, eventually, emission of carbon into the air. Until this happens, carbon is stored in the dead organic matter pool, and can be regarded as carbon stored within the forestry system. This pool can store substantial amounts of carbon in natural forest ecosystems, where the size of the dead organic matter pool can be as high as the aboveground biomass pool. Leaving dead trees and branches in the forests is, therefore, beneficial from climate change mitigation poin of view.
The amount of dead plants and plant parts is modelled by simply summing up mortality, harvests (final cuttings and thinnings), and decomposition.
The accuracy of the amount of carbon in dead wood always depends on the accuracy of the processes that increase or decrase it.
Description – Modelling – Limitation, sources of error – Accounting functions
Wood products are manyfold. They are sometimes grouped into products produced within the forestry sector and those in the the wood industry. CASMOFOR uses "wood products" to refer to wood within the forestry sector. It does not model what happens to wood products after they are sold to the wood industry. However, it is supposed that wood products have a lifetime during which they store carbon, and after which they are burnt of decomposed, or stored in long-term pools like landfills or soil. In order that the carbon in these products be full part of the carbon cycle of afforestations, the all the amount of the carbon in them is accounted for.
The amount of wood products is increased by the amount of harvested and processed timber, and decreased by the amount that is burnt or deposited in landfills and soils after their use.
Limitation, accuracy, sources of error
The accuracy of the amount of wood products depends on the accuracy of modelling the processes that increase and decrease it. It must be noted that it is very uncertain for how long timber is used, and for how long it will be used in future. Moreover, wood products can be produced after the trees planted have reached a certain size. Therefore, it usually takes decades after the trees are planted, until wood products can be produced. Therefore, the amount of wood products becomes important only decades after starting the afforestation project.
Description – Modelling – Limitation, sources of error – Accounting functions
When harvesting, a part of the wood of trees can only be used for burning. There are even cases when timber is grown for fuelwood, although forestry today aspires to produce high quality timber. With the importance of climate change mitigation, however, the use of carbon neutral fuelwood increases, too.
The amount of fuelwood depends on how much is produced (from harvests and from worn-out wood products) and how much is burnt. It is assumed that all fuelwood produced in a year is burnt in the next year.
The accuracy of the amount of fuelwood depends on the accuracy of the model of the processes increasing or decreasing it. However, it must be pointed out that, since almost all carbon stored in fuelwood is emitted into the air soon after the fuelwood is produced, the accuracy of the size of this pool may only be important for any year, but it is of practically no importance in the long run.
Pool: DECOMPOSING WOOD PRODUCTS
Description – Modelling – Limitation, sources of error – Accounting functions
After their end of use, wood products are either burnt or are subject to decomposition. Like dead organic matter, decomposing wood products store carbon until they are fully decompose, so until their carbon is emitted back to air. If the worn-out wood products are burnt, their carbon gets back to air very quickly, so more and more countries that do not rely on the energy in these products try to bury them so that carbon is lost to the air at a low pace.
The amount of decomposing wood products depends on how much is produced (from unused wood products) and how much is deposited in landfills.
The accuracy depends of the accuracy of the models of the processes changing the size of the decomposing wood products pool. It must be noted, however, that, in afforestation programs, wood products become unused several years after their production, which itself can take place only decades after the afforestations. Thus, the importance of this pool in terms of accuracy of modelling the whole system only becomes important decades after the beginning of the afforestation program.
This webpage was last modified by Zoltan Somogyi 28 Sept 2023.